This week on #WorkoutWednesday challenge was set by Luke Stanke and it was about using analytical capability of Tableau specifically clustering. We can perform customer segmentation using clustering algorithm of Tableau but here we will implement clustering algorithm using sub-category and region. In this post, we will go through step by step process of creating clustering and then build Hub & Spoke plots.
Requirements for Workout Wednesday:
- Dashboard size is 700 x 800; tiled; 2 sheets
- Create clusters using Profit Ratio (Total Profit/Total Sales) and average discount from only 2015 for sub-category and region. This is the basics of segmentation
- Show the consistency of each cluster by plotting this over year, as well.
- Match tooltips.
- Label the clusters in 2015. Only show the label once. Don’t place many marks of text on top of each other.
- Match color and formatting. I’ll be paying attention to all parts.
- JEDI ONLY: Create hub-and-spoke plots that connect the center of each cluster to the value sub-category/region combinations that are part of the 2015 cluster.
Data for the workout can be downloaded from here
Here is my output for the challenge (Click on Image for interactive version):

Step 1: Import the superstore data into Tableau then drag orders sheet multiple times into data area and you should be able to see something like this:

Once data is imported then go to sheet 1
Step 2: As per requirement, we will create clusters using 2015 data on the basis of profit ratio and avg discount. First we will create profit ratio calculated field:

Drag order date from dimensions and filter for the year 2015:

Drag discount field into columns and convert into average then drag profit ratio field into rows. Post this, drag region and sub-category field into details under mark area as shown in below image:

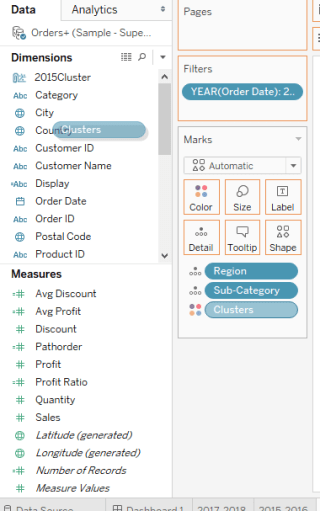
Step 3: From the analytics tab, drag clustering into visualisation area as shown below:

Enter number of clusters as 3

Drag cluster created into data area to create the group and freeze the clusters based on 2015 data and rename the field as 2015Cluster:
you can click on edit the group field and see that 3 groups are created on the basis of 3 clusters:

Step 4: Next step is to create calculated fields to show average profit and average discount on the basis of sub-category, region and cluster:


Step 5: Add new sheet, drag order date to filters and apply filters for year 2015 and 2016. Drag order date (select year) and avg discount field (convert the measure into average) to columns section

Drag avg profit field twice into rows section (convert the measure into average)

Step 6: Change the chart type for first Avg Profit field to line chart then add Region and sub-category fields into details along with Table Name field into path as shown in below image

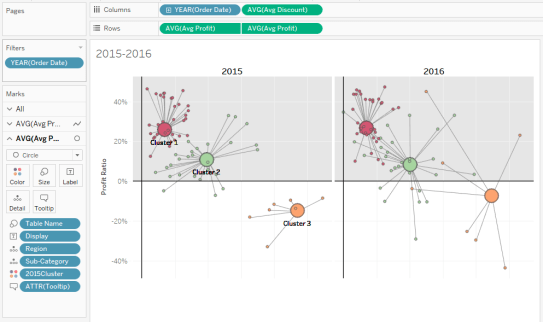
Step 7: Change the chart type for second Avg Profit field to circle chart then add Region and sub-category fields into details and drag Table Name field into size as shown in below image then drag 2015cluster field into colors as shown in below image:

Change the graph into dual axis then the data visualisation layer looks like below:

Perform bit of formatting and adding a reference line will make it look like this:
Duplicate the sheet and change filters to 2017 and 2018 then add both the sheet into dashboard. As per requirement change the dashboard size to 700 * 800 and your dashboard is ready with visualisation.

Tableau file can be downloaded from here.
Happy Data Visualisation!!!!
Thanks for visiting this post. Please do let me know your feedback and if any particular topic you would like me to write on.
Do subscribe to Tabvizexplorer.com to keep receive regular updates.